Shiny Applications…
Power-4 Girth Index — Roster & Recruiting Intelligence
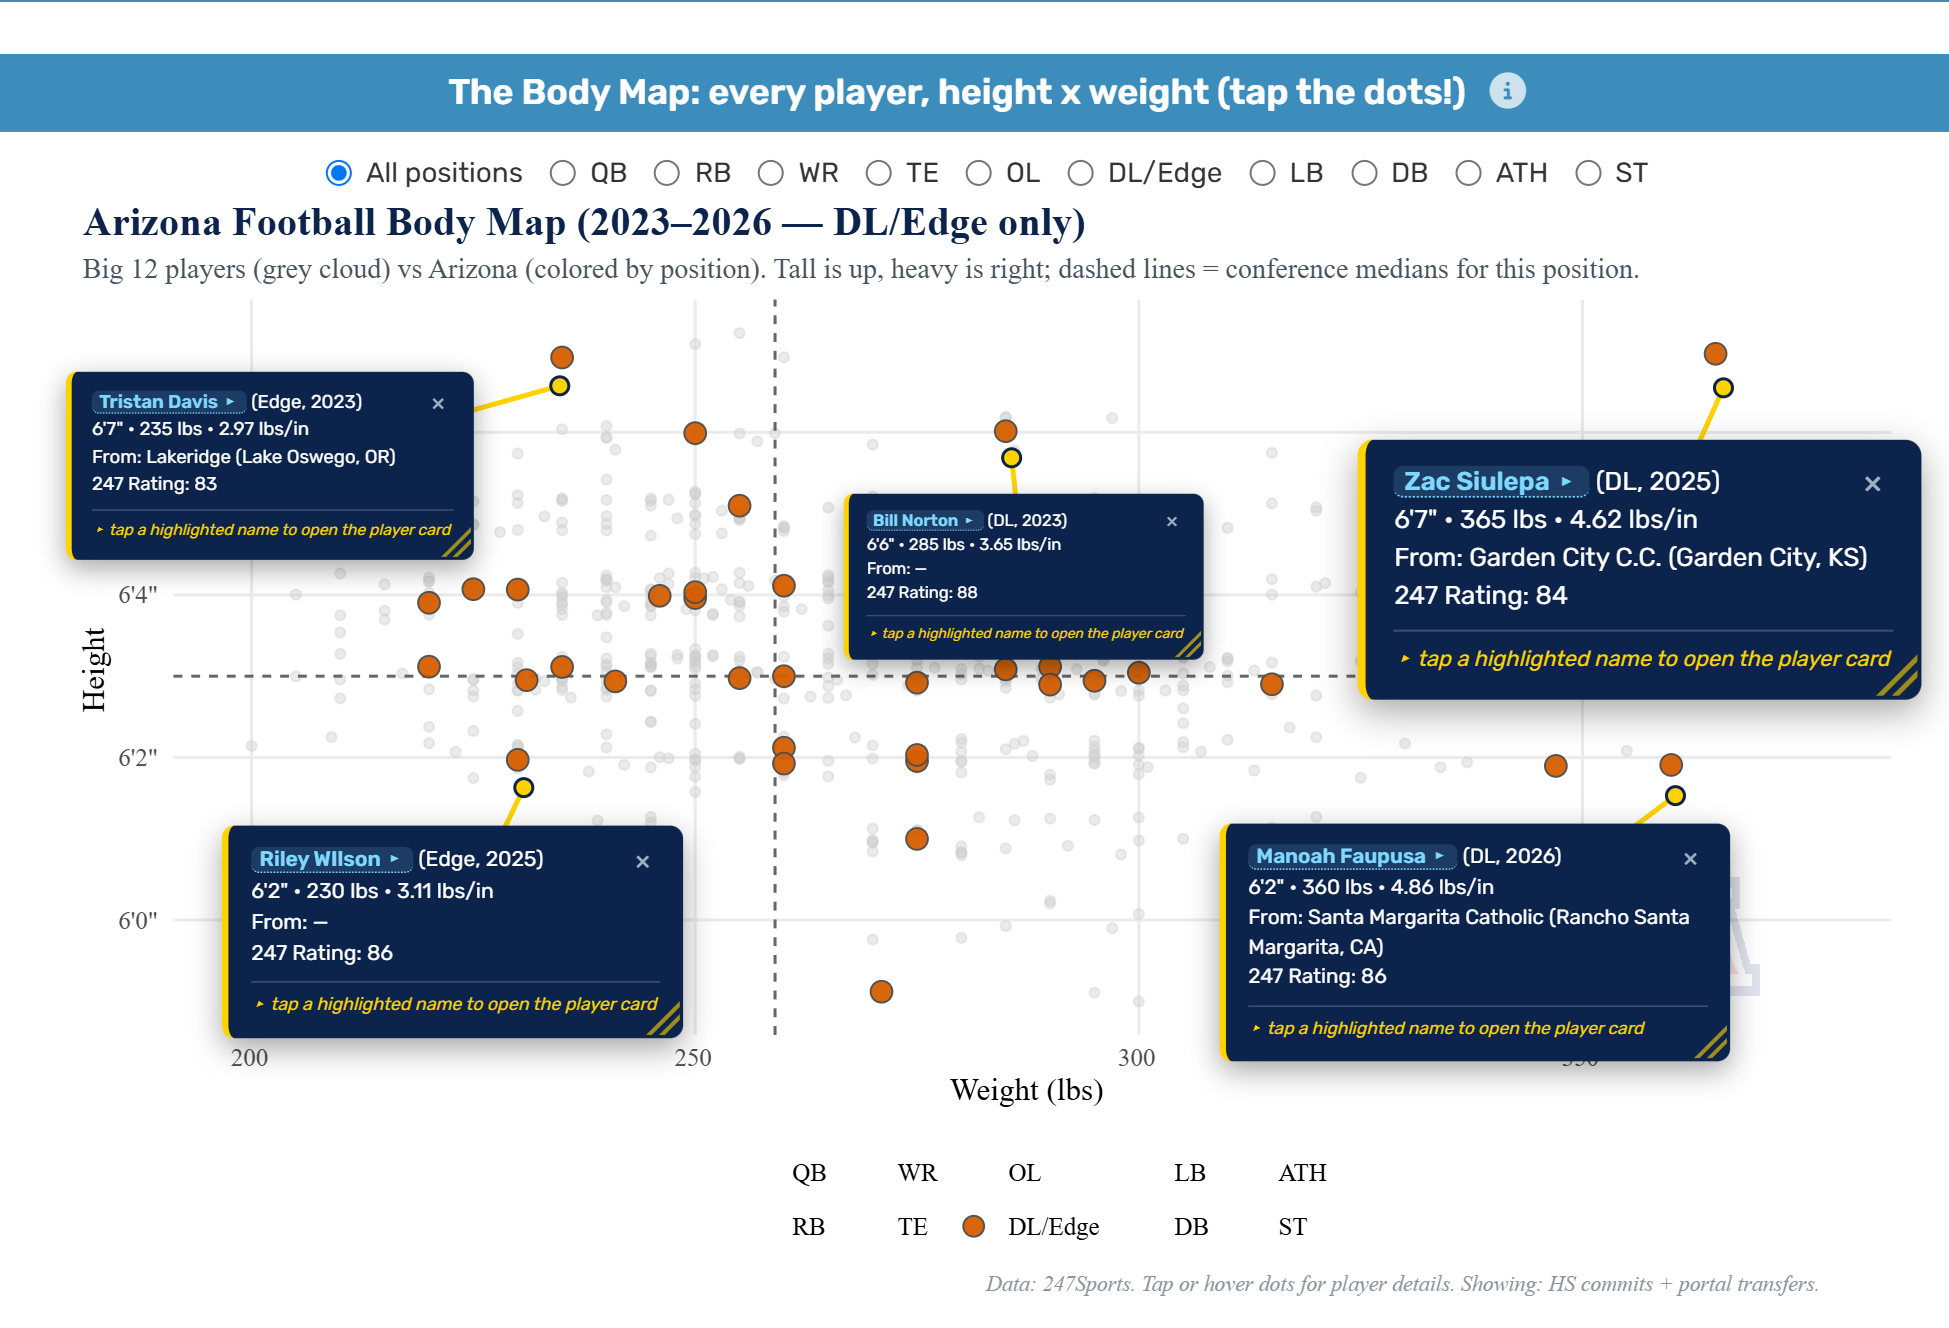
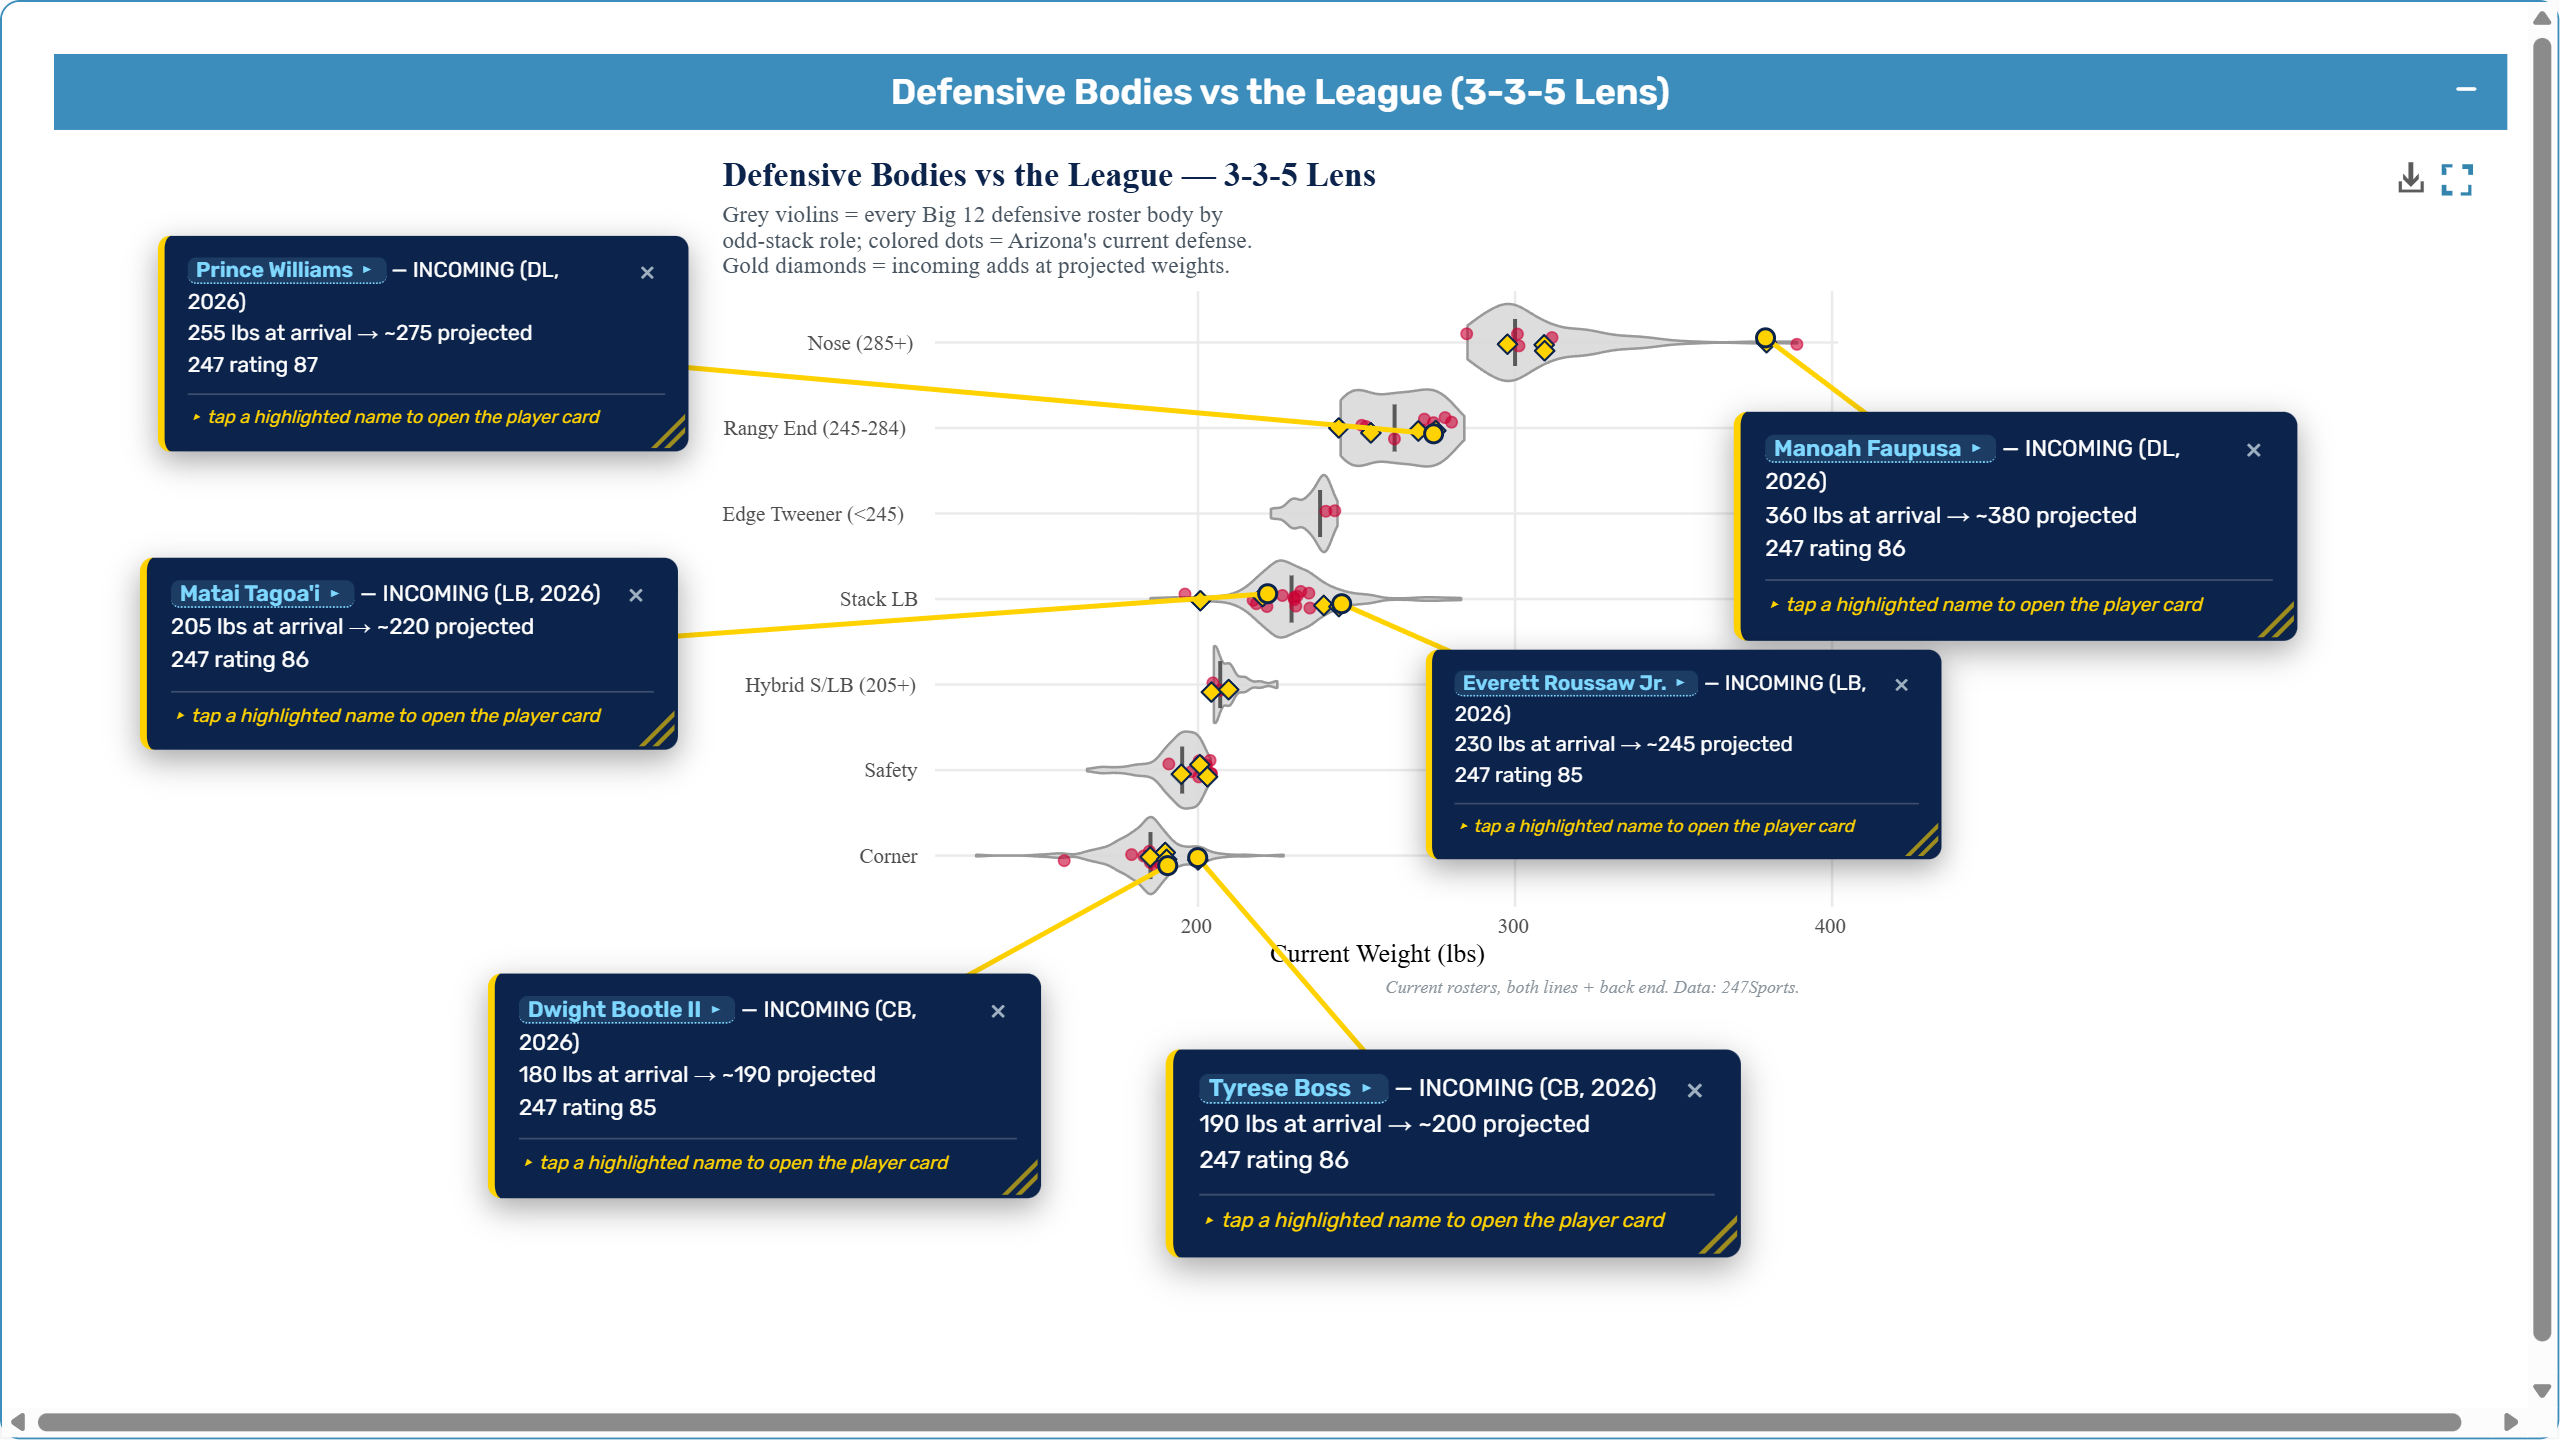
This app compares how all 67 programs across the ACC, Big Ten, Big 12, and SEC build football and basketball recruiting classes from 2016–2027. Its redesigned dashboard establishes the live picture first: source and pipeline freshness, program coverage, completed seasons, open classes, and sport-specific snapshots. From there, explore height × weight Body Maps, Position DNA, team reach, recruiting and coaching-era trends, and role projections; Talent Origins maps the last listed high-school or prep location of captured signees by state, position group, and year. The direct Matchup view compares any two programs — for example, Arizona vs. Alabama — while keeping each program’s rankings and averages in its own-conference context. Data comes from 247Sports and CollegeFootballData, with sample sizes, open-cycle flags, and limitations stated in context. A Power-4 relaunch of my earlier Big-12 Talent Pathways app.
NEON Small Mammal Tracker
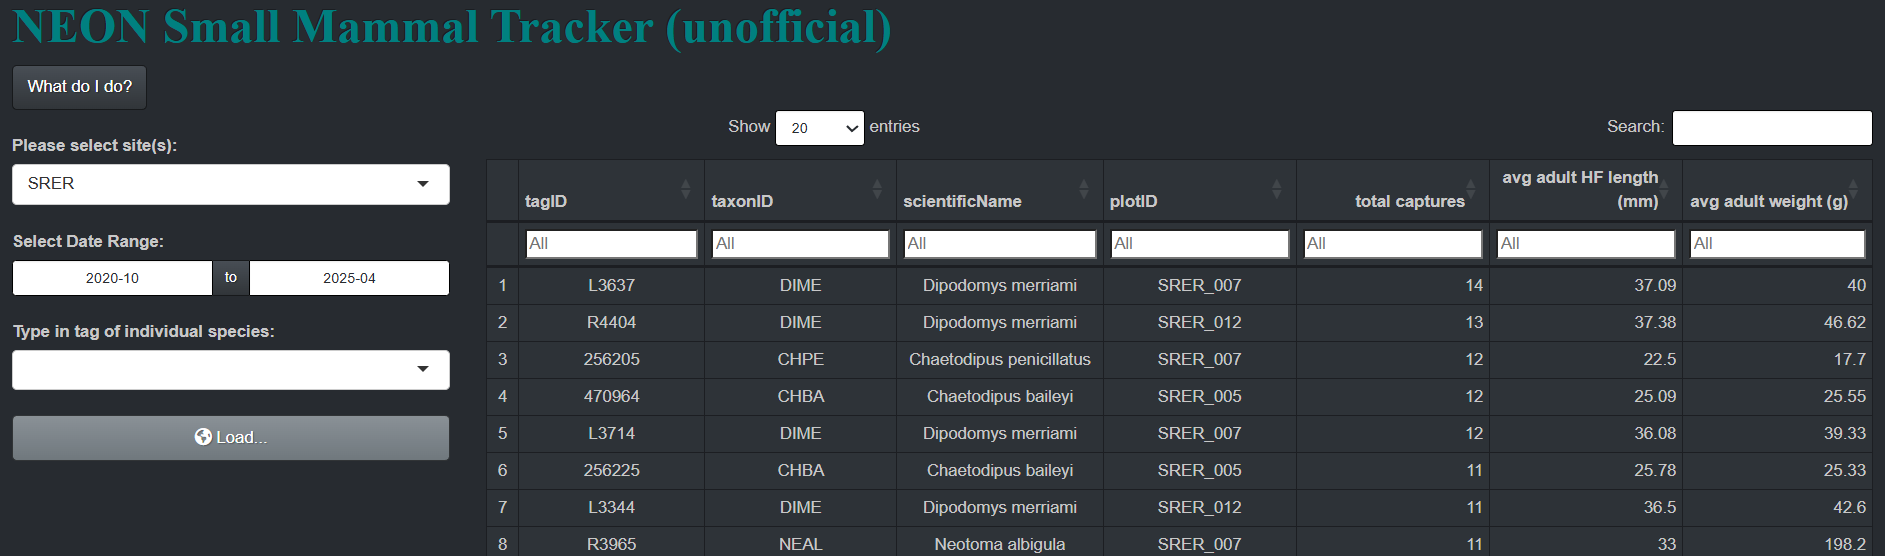
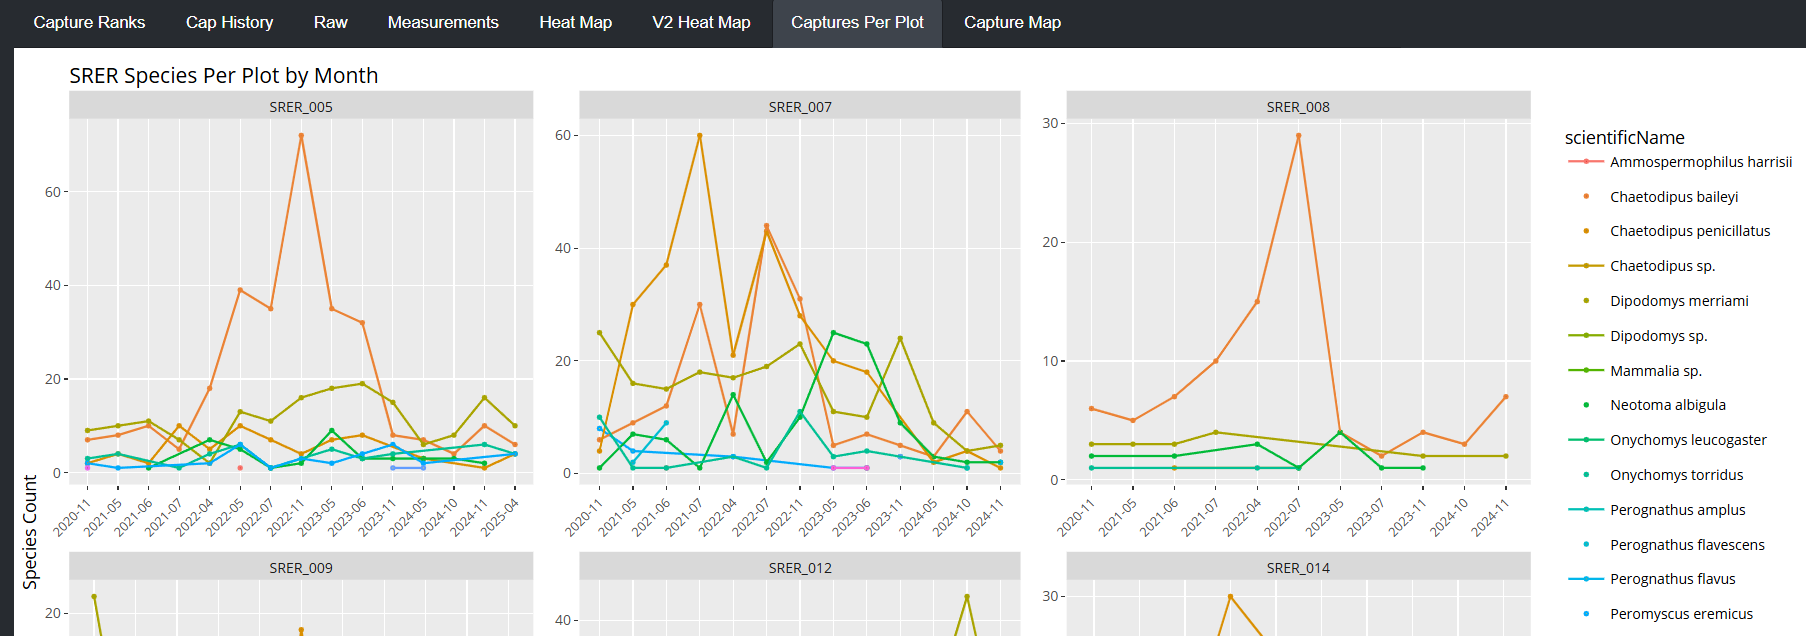
This shiny application turns National Ecological Observatory Network (https://data.neonscience.org/) box-trapping records into the life history of every small mammal NEON has caught across 46 field sites. It opens on a tap-a-site national map — pick a site to see who lives there, or flip to “by species” to map where one animal turns up across the country. Open any site for a Hall of Fame of the most-caught individuals (re-sortable, with rarity tiers), trap-grid home-range heatmaps, a Hill-number diversity profile, and detection-corrected abundance — closed-capture estimates (Schnabel / Chapman) that count the animals the traps missed, shown alongside MNKA. Plus shareable trading-card profiles, a two-site compare, and a printable report card. Methods are stated honestly: reused tags are flagged, Chao1 is a bias-corrected lower bound, and the size index is an adult weight percentile. Each site loads instantly from a pre-bundled, compressed dataset. A complete redesign of my original tracker.
Explore the NEON suite
Click the Driver Cascade to explore its sibling NEON flora, fauna, and aquatic apps. It fans the nine explorers out around the hub; click again to open the capstone itself, or tap any sibling to dive in.
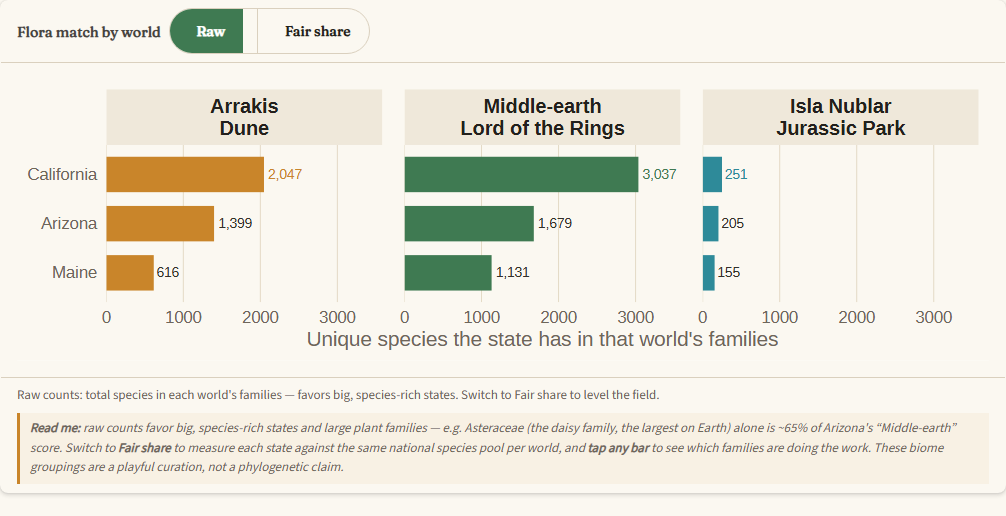
Which State’s Flora Matches Each Movie World Best?
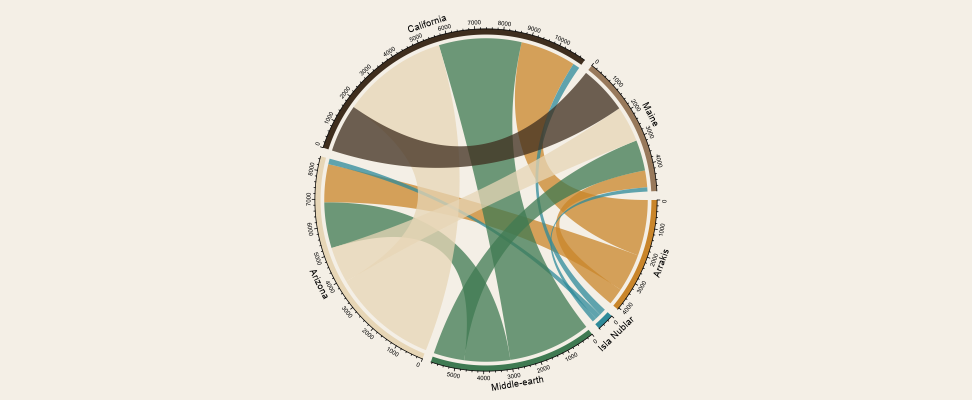
This Shiny app asks which U.S. state’s plant life best fits three movie worlds — Dune (Arrakis), The Lord of the Rings (Middle-earth), and Jurassic Park (Isla Nublar) — each defined by a curated set of plant families (desert & succulent, cool-forest & alpine, and ancient ferns & conifers). Pick any states and an interactive bar chart ranks their flora against each world; tap a bar to see exactly which families drive the score, and toggle Raw counts → Fair share to control for the fact that big, species-rich states and giant plant families — Asteraceae alone is ~65% of Arizona’s “Middle-earth” score — would otherwise dominate. A chord diagram then maps the species each state shares with every world, and with the other states. Built on ~250,000 USDA PLANTS records precomputed into an ~11 KB bundle so it loads instantly. A full rebuild of the original — an honest, size-adjusted metric and a botanical field-guide redesign.
Older Applications
USFS Name Converter ⭆ Click for Stand Alone App