Tim Gilbert
  • Home
  • Experiments
  • Projects
  • Field Notes
  • About
  • Résumé

Selected work

Data products, field tools, and interactive websites.

Selected projects across ecology, operations, sports analytics, and creative web development.

Browse projects ↓View résumé
EcoPlot Mobile site view

01 · Flagship platform

EcoPlot Mobile

Offline ecological collection → cloud sync → office review → reporting.

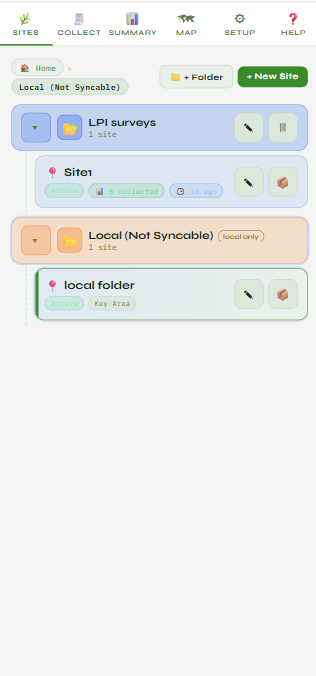
I architect and build this progressive web app for Desert Data Labs. It supports standardized and custom protocols, on-device storage, concurrent-edit detection, GPS, photos, maps, and an Azure-backed office workflow.

  • PWA
  • Azure SQL
  • Offline sync
  • Product design
Read case study →Open live app ↗
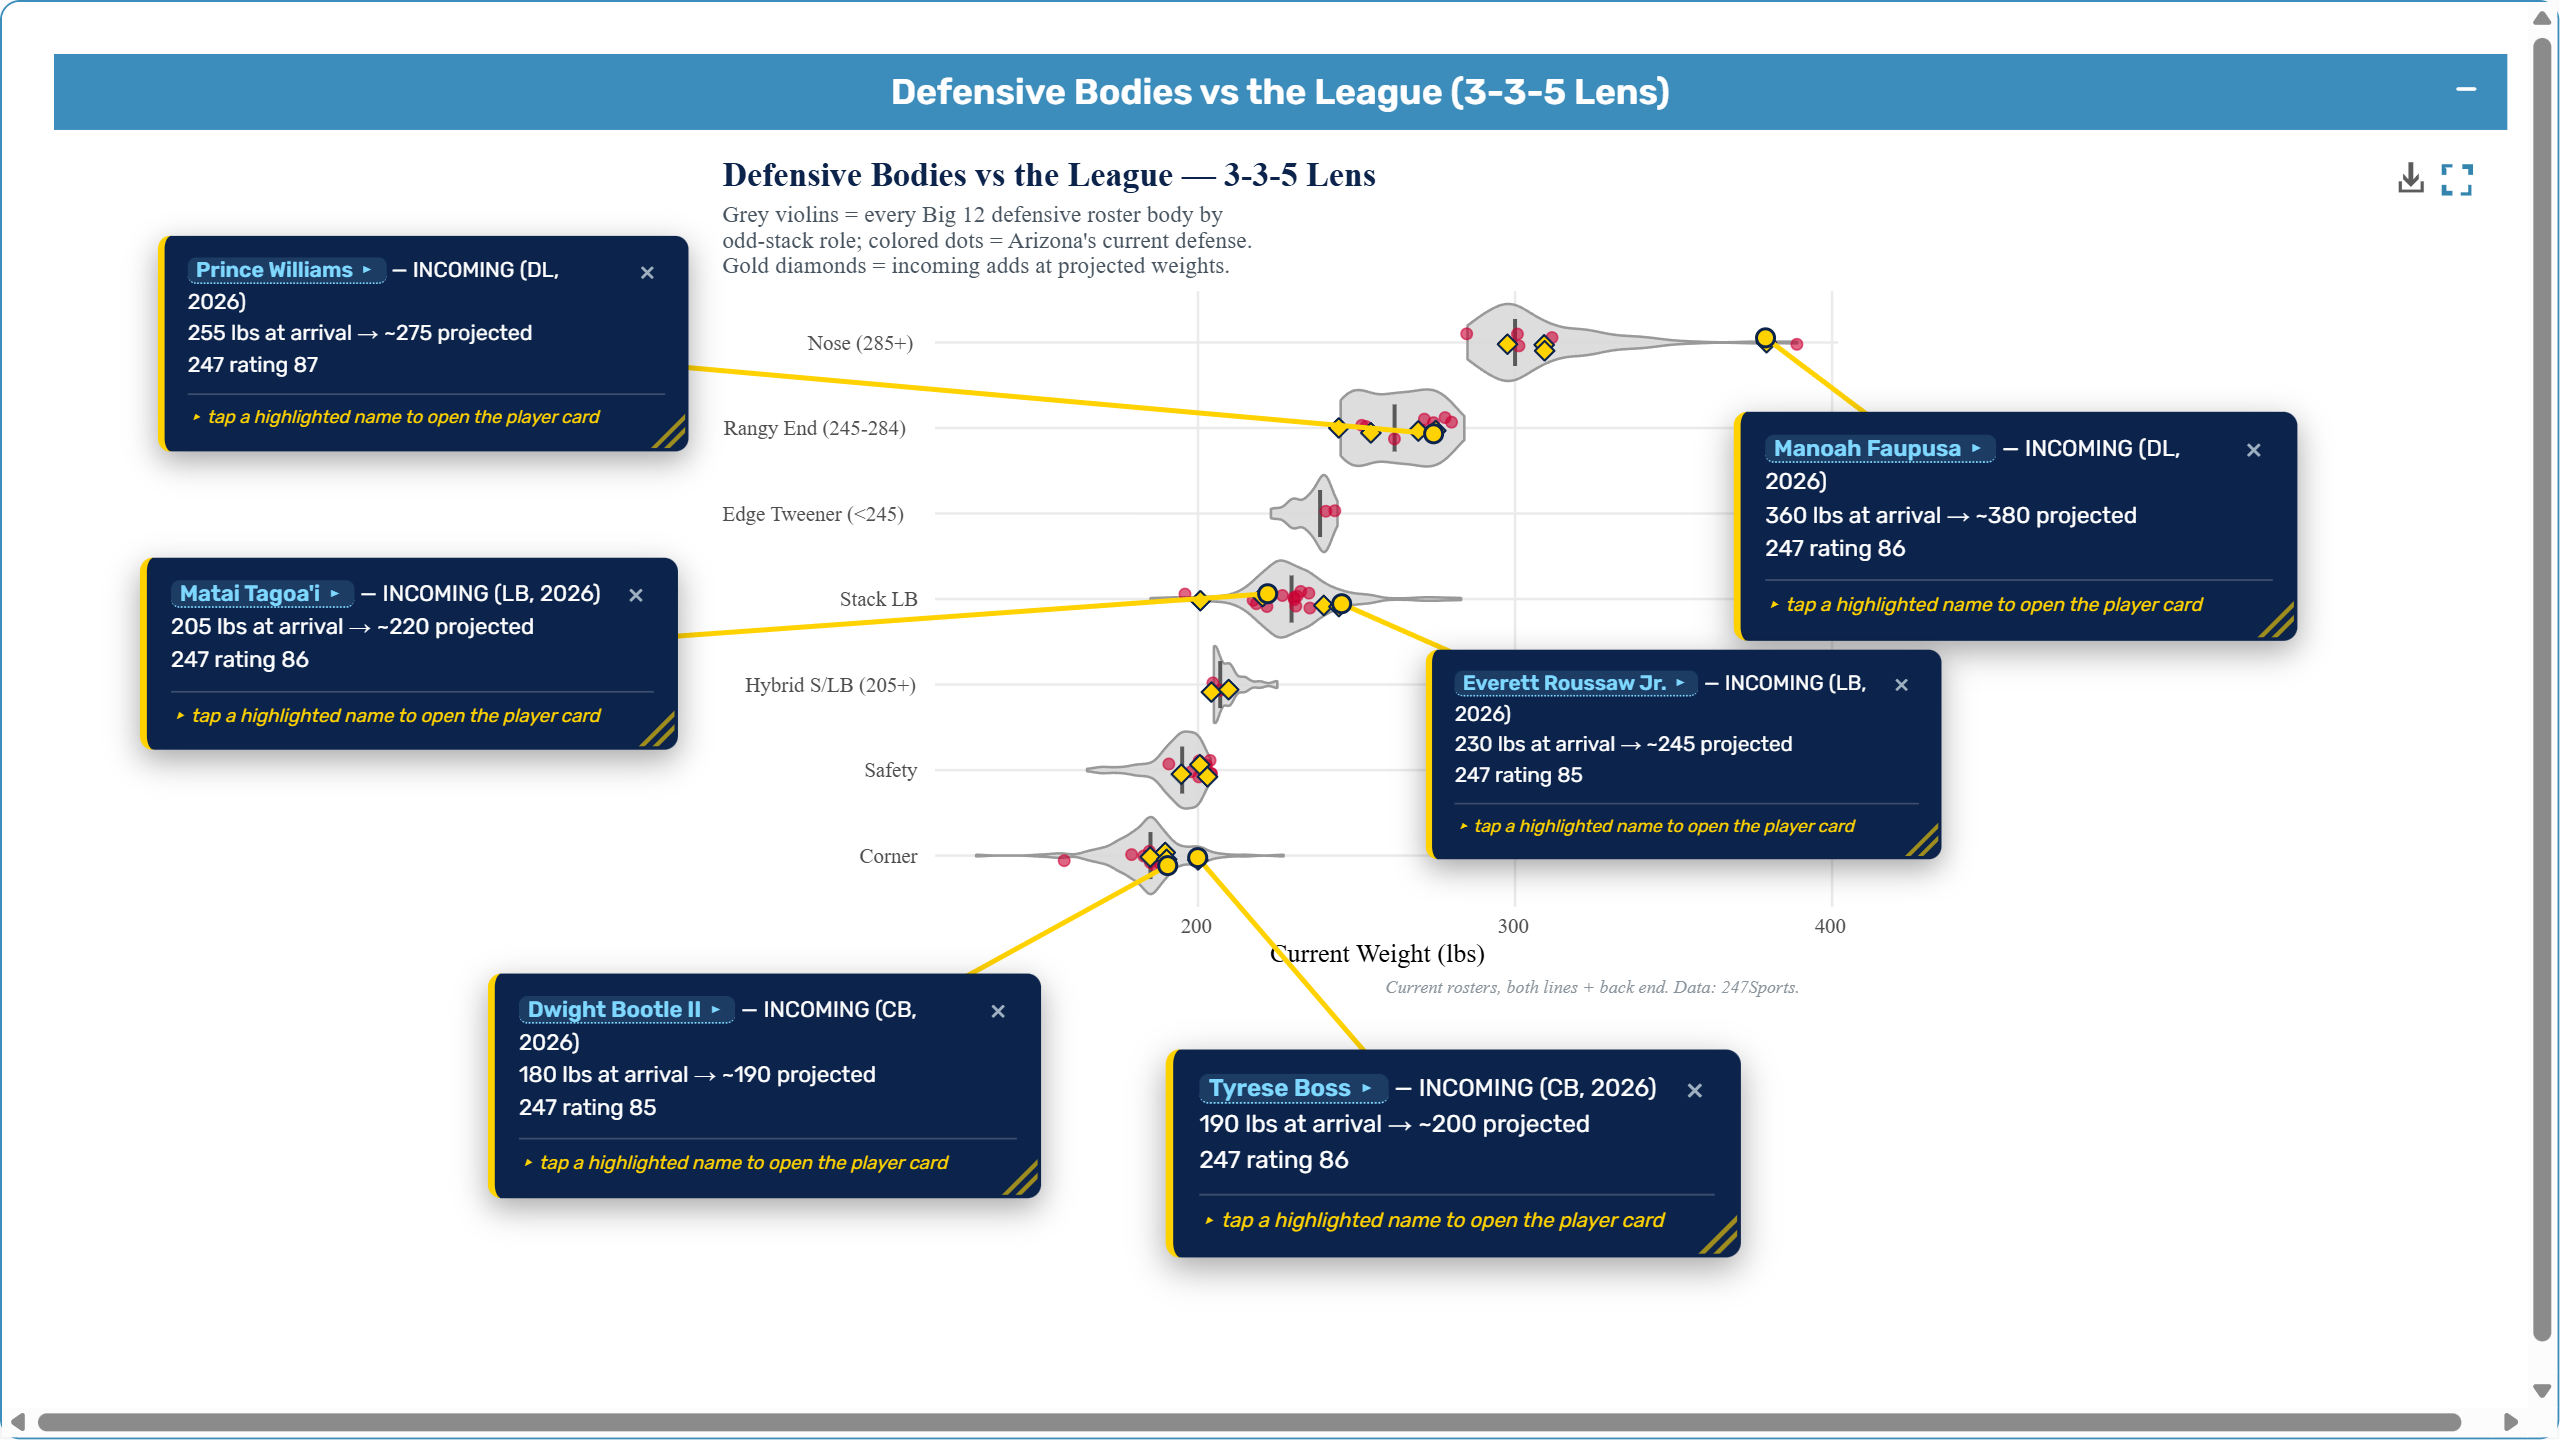
Power-4 Girth Index defensive war-room interface

02 · Sports data product

Power-4 Girth Index

Recruiting data becomes a live roster-intelligence lab.

A transparent dashboard shows data freshness and coverage before body maps, position profiles, team reach, and Talent Origins reveal how rosters are built—and where high-school talent comes from—across all 67 ACC, Big Ten, Big 12, and SEC programs.

  • R Shiny
  • Data pipelines
  • Plotly
  • Geospatial analysis
Open live app ↗
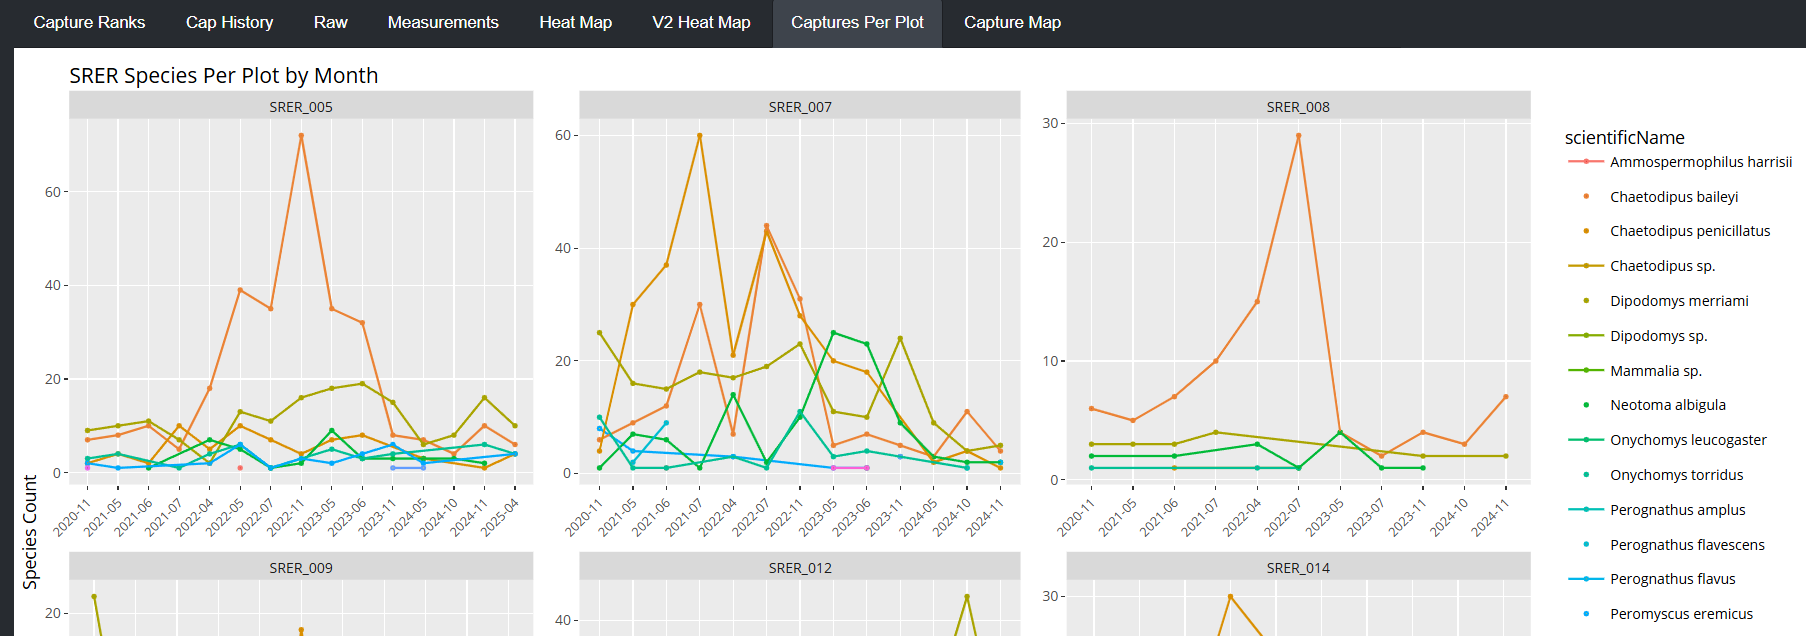
NEON Small Mammal Tracker animal profile

03 · Ecological analytics

NEON Small Mammal Tracker

National monitoring records, made personal and explorable.

Site maps, individual capture histories, home-range heatmaps, diversity profiles, detection-corrected abundance, and transparent method notes turn a large public dataset into a useful field guide.

  • R
  • Ecological stats
  • Mapping
  • UX
Open project ↗
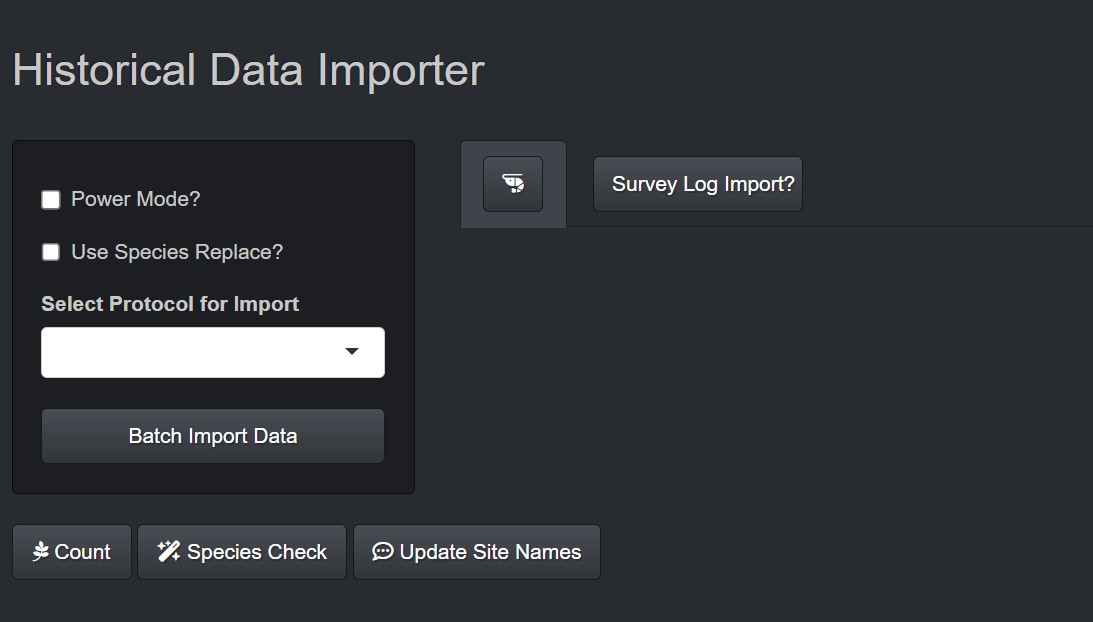
VGS Batch Importer main interface

04 · ETL + QA/QC

VGS Batch Importer

Historical spreadsheets become structured, checked field records.

An R pipeline parses multiple vegetation protocols, resolves metadata, flags data-quality problems, and loads clean records into a local SQLite field database.

  • R
  • SQLite
  • Excel
  • QA/QC
See implementation details →
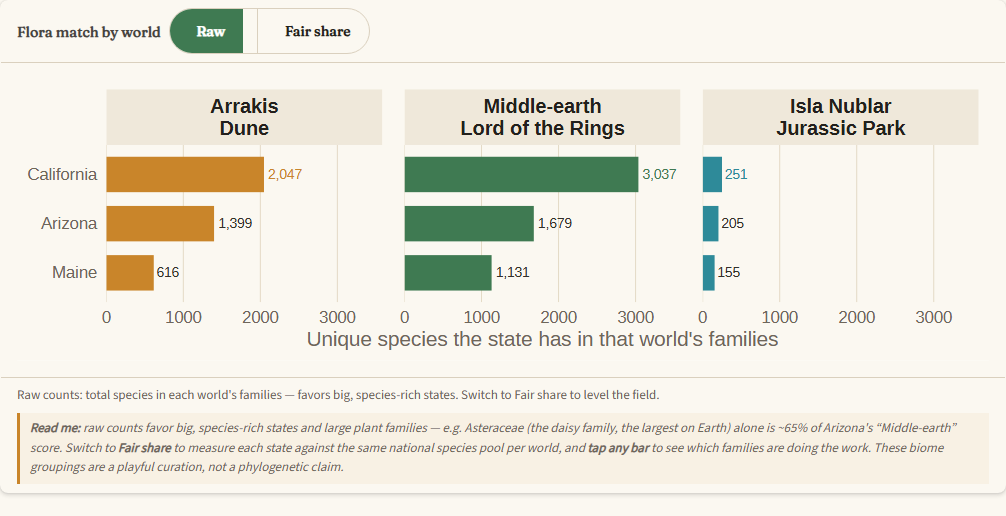
Plants in Movies botanical comparison chart

05 · Data storytelling

Plants in Movies

Which U.S. flora best matches three imagined worlds?

A size-adjusted botanical comparison of Arrakis, Middle-earth, and Isla Nublar, built from roughly 250,000 USDA PLANTS records and compressed into a fast interactive experience.

  • R Shiny
  • USDA data
  • Visualization
  • Storytelling
Open project ↗
VGSLite desktop database helper

06 · Desktop utility

VGSLite

Practical database maintenance without asking users to write SQL.

An Electron-packaged R helper for repairing links, moving events, clearing deletion caches, converting databases, and reducing common support work in VGS 5 Desktop.

  • R
  • Electron
  • SQLite
  • Windows
See features →

Interactive web

Three browser-based experiments.

Framework-free sites built around procedural graphics, scrolling, sound, performance, and accessible fallbacks.

Tucson stadium glowing at nightScroll + sound

The Long Saturday

One desert day, from first light to kickoff.

Canvas film scrubber · field-recorded soundscape · four scroll movementsOpen site ↗
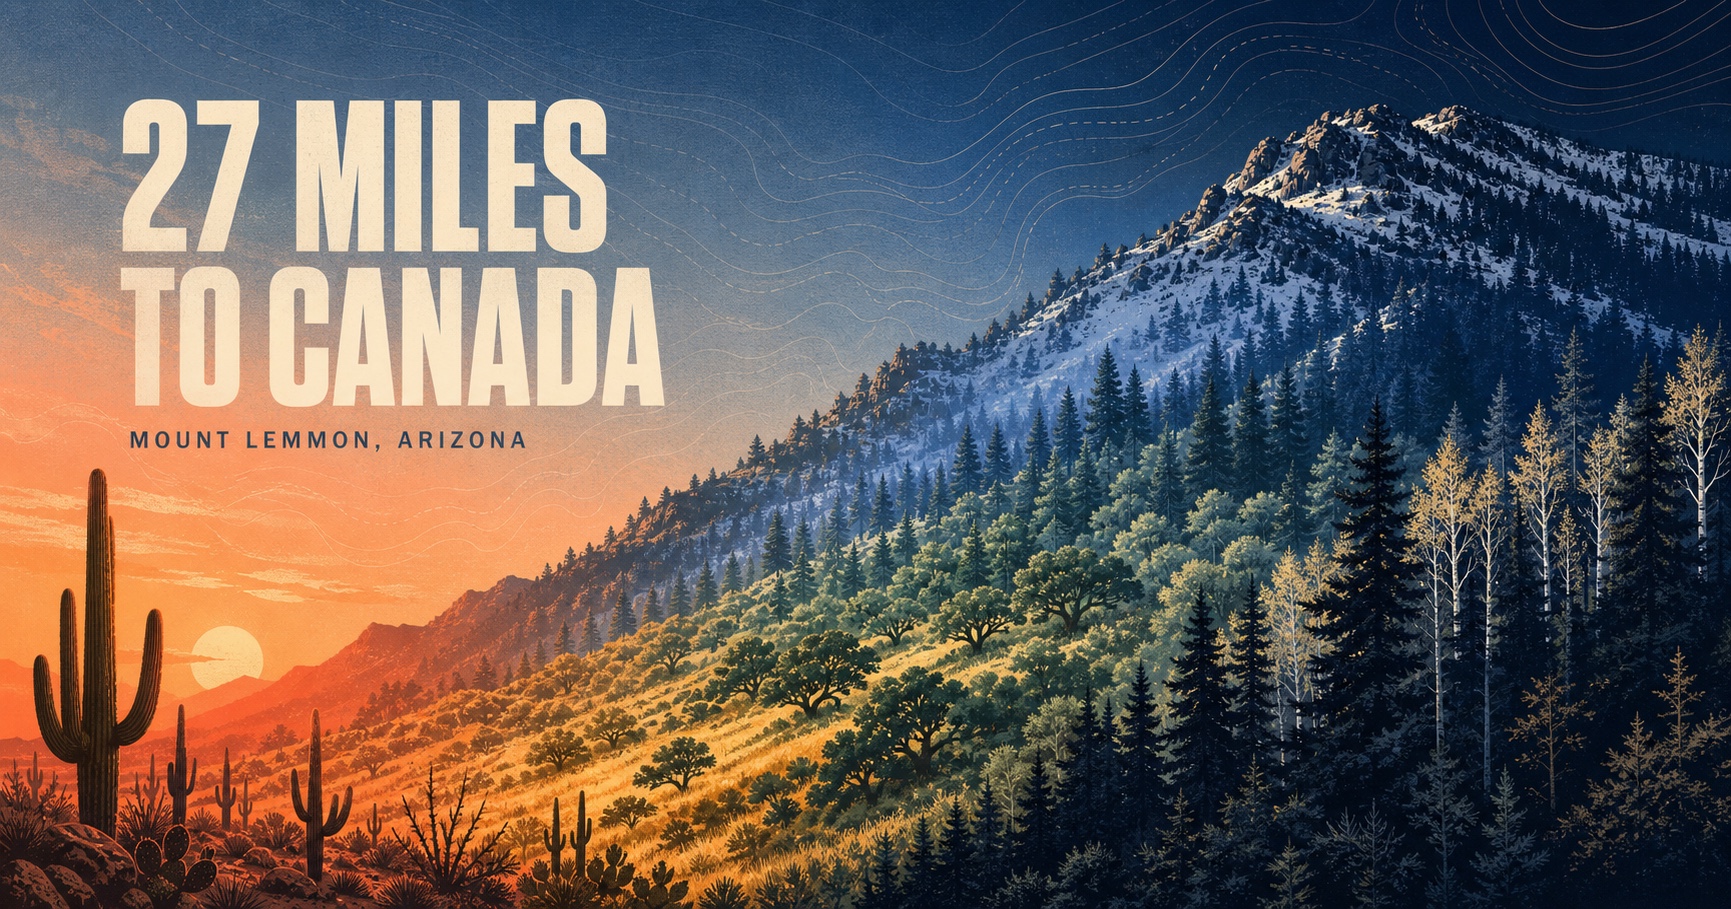
27 Miles to Canada, Mount Lemmon interactive ascentProcedural Canvas

27 Miles to Canada

A mile-by-mile climb from desert to mixed-conifer forest.

Six biotic communities · elevation profile · modeled temperatureOpen site ↗
The Orrery procedural solar systemProcedural world

The Orrery

Eleven worlds, one shared clock, and a derelict ship.

Canvas-baked scenes · generative audio · persistent survey stateOpen site ↗

More work

Additional projects and archives.

Browse Shiny applications →Browse utilities and analyses →Browse the field archive →