One more way to explore
Take a shot at my portfolio.
Play with a copy of this page in Sprite Fusion.
A game by Hugo Duprez / Sprite Fusion ↗ Destroy my portfolio
Mouse or touch to aim.
Phone: landscape. Esc pauses.
Tim Gilbert / Tucson, Arizona
I’m an ecologist and data scientist who builds R Shiny apps, databases, scrapers, offline field tools, and interactive browser experiences. I like making complicated things easier to use, and a lot more fun. Projects built with assistance from Claude (Anthropic) and Codex (OpenAI).
Field identification / TG-14
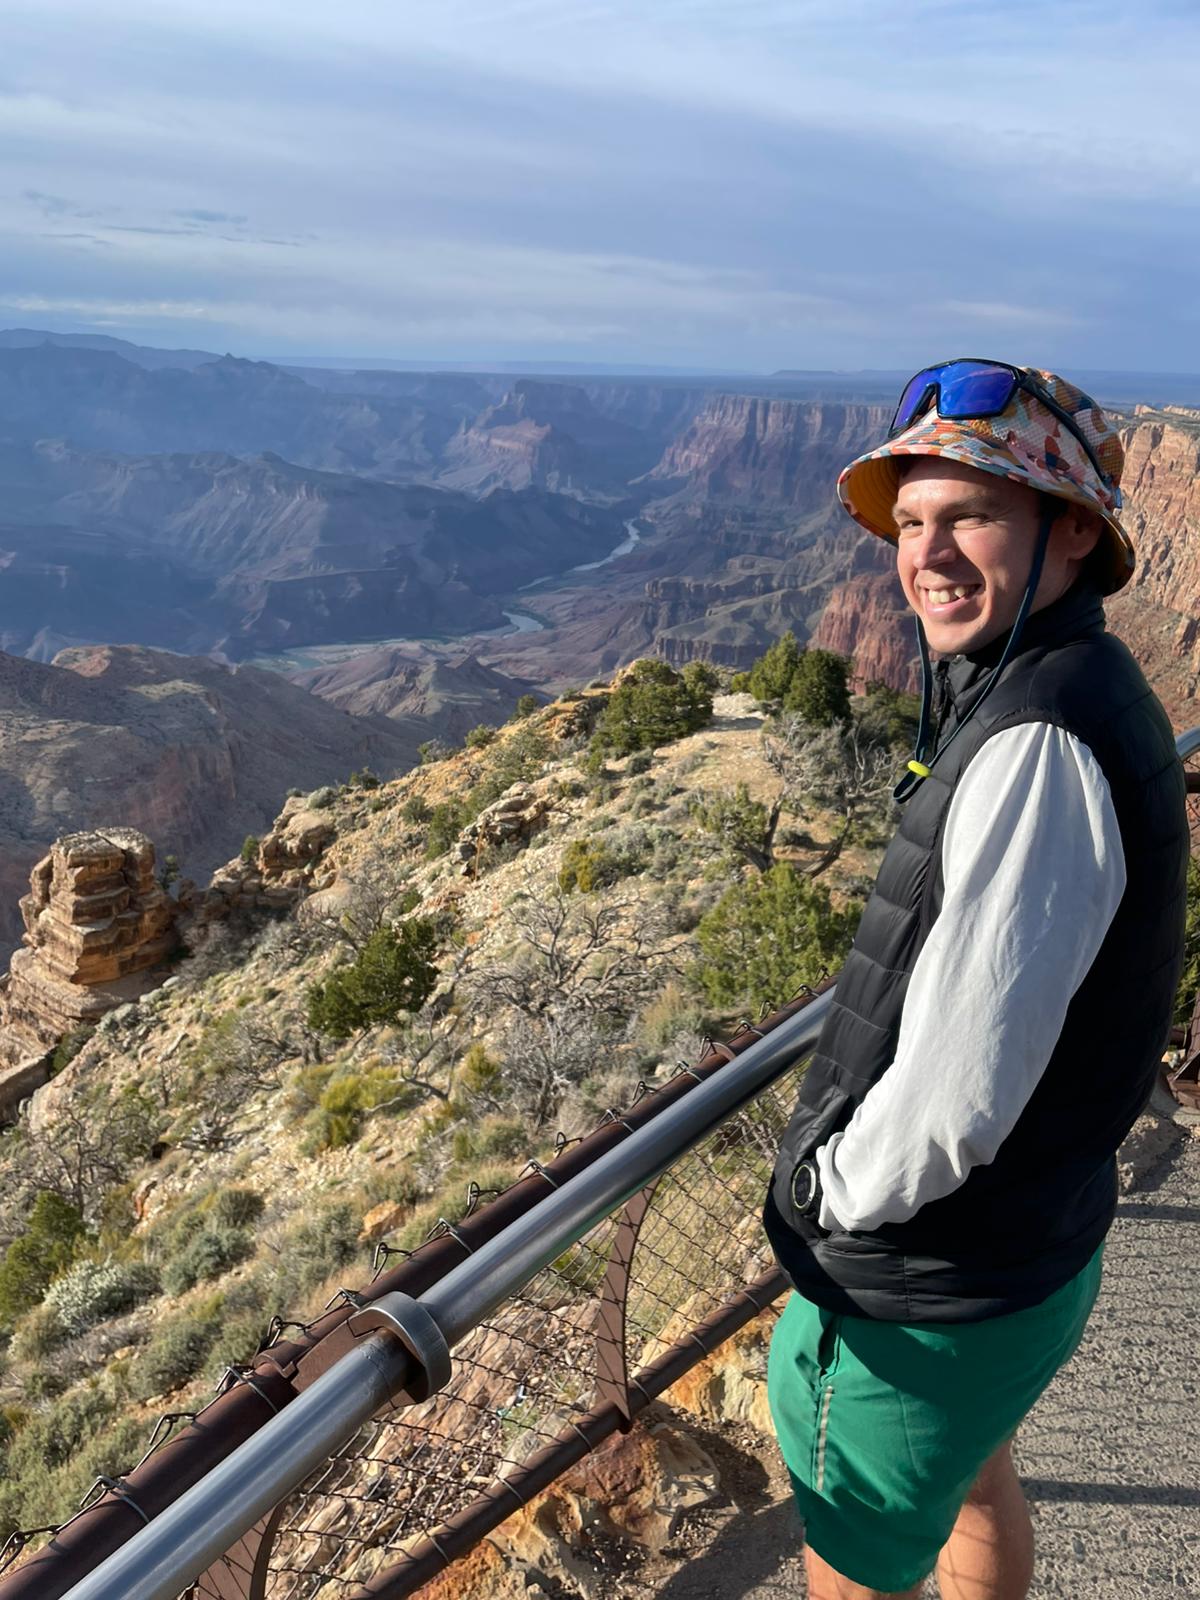 36.10° N / 112.11° W
FIELD RECORD ACTIVECANIS MODE ACTIVE
Interactive web
Explore ecological records and a paired storm model. Keep going for a Tucson Saturday, a mountain road, and a dead spaceship.
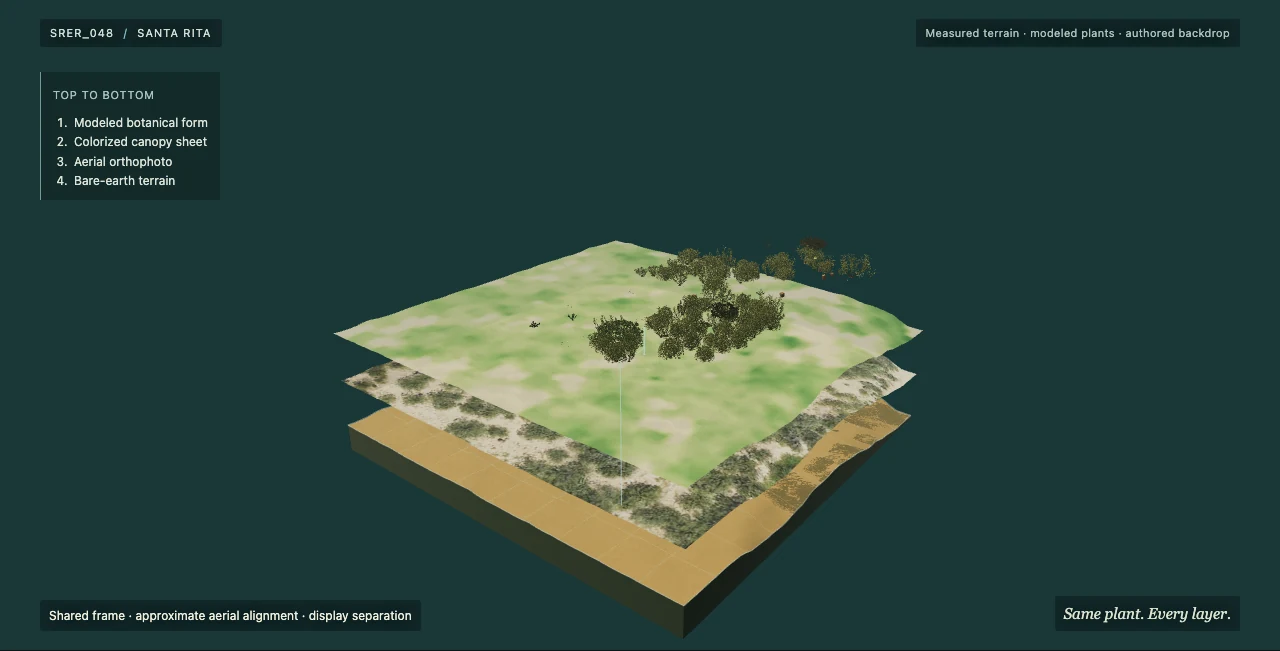
Living X-Ray
Native NEON terrain, aerial and canopy layers, and 179 tagged plant records. Select a plant to inspect its source measurements and model defaults.
Measured terrain · modeled plants · source receiptsExplore the plot ↗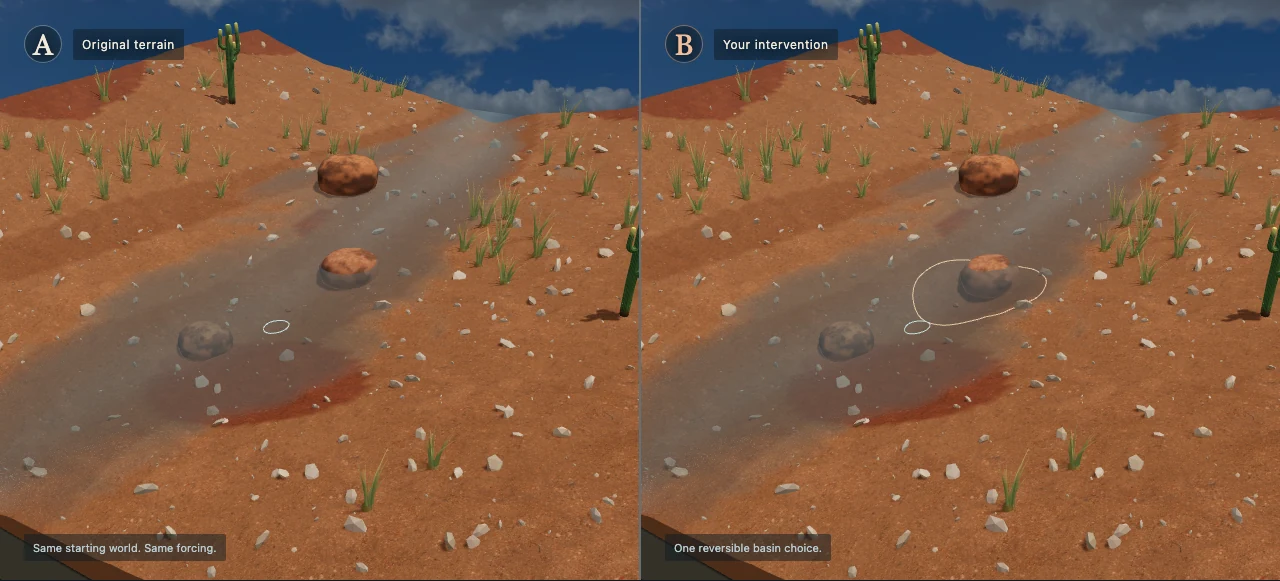
Two Futures
Run two copies of the actual Storm Table model on one clock. Inspect the first sustained difference and save the paired view, ledgers, and recipe.
Time-compressed, uncalibrated exhibit. Not a site forecast.Compare the storm ↗ Scroll + sound
The Long Saturday
 Procedural Canvas
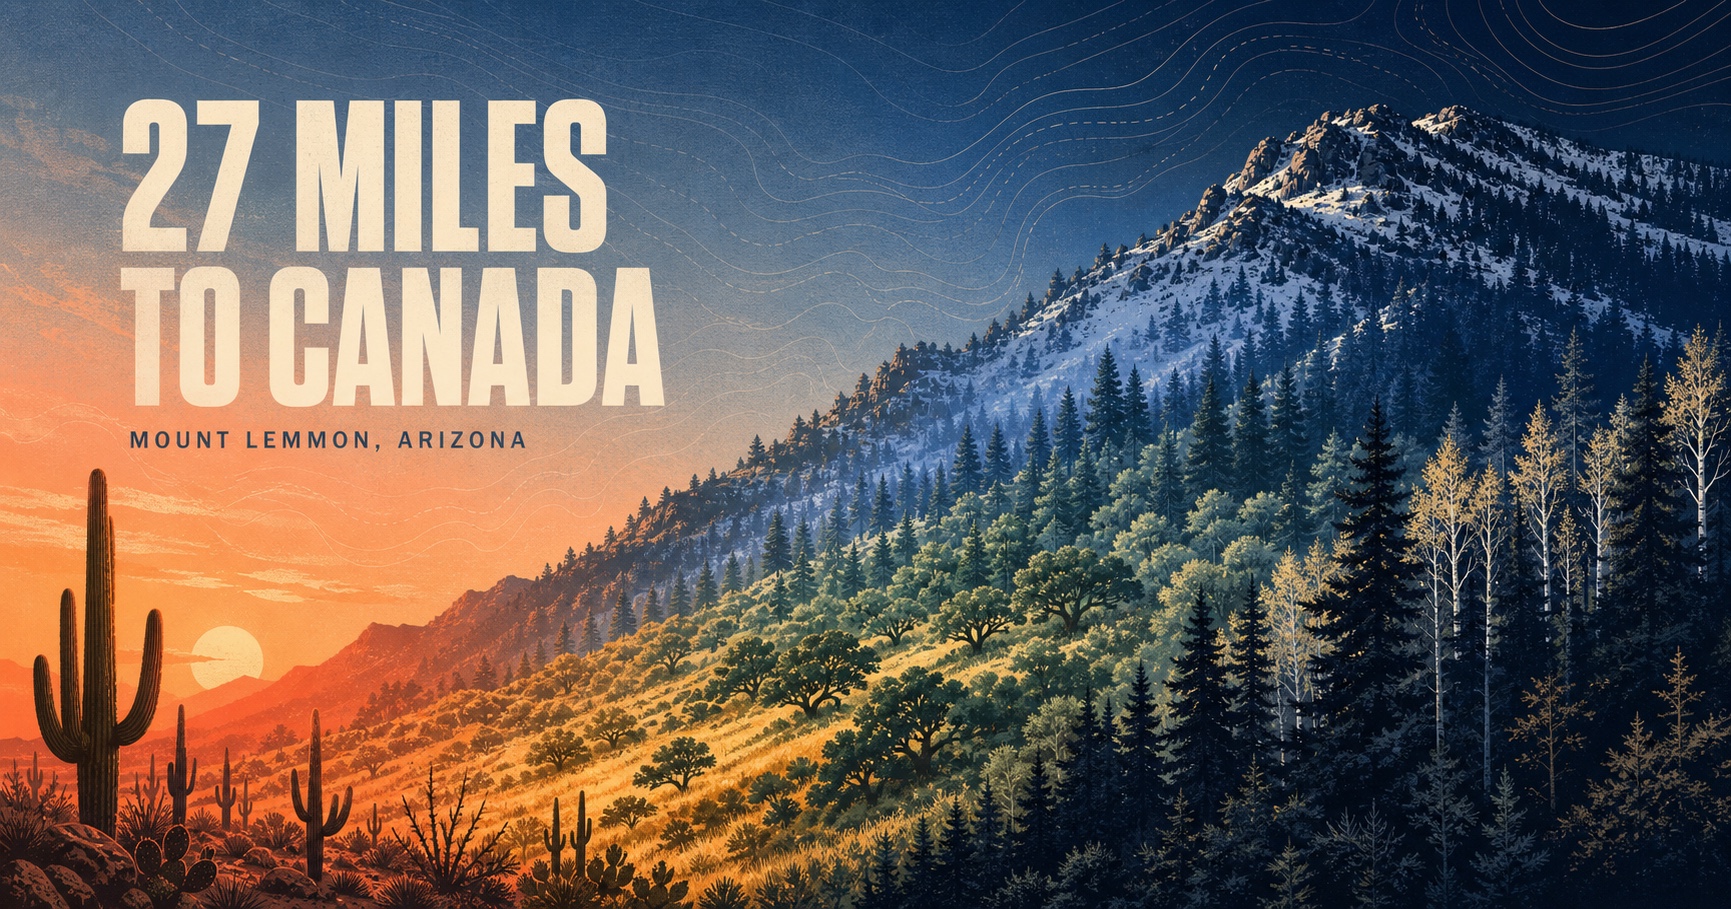
27 Miles to Canada
 Procedural world
The Orrery
One more way to explore
Play with a copy of this page in Sprite Fusion.
A game by Hugo Duprez / Sprite Fusion ↗Destroy my portfolio
Mouse or touch to aim.
Phone: landscape. Esc pauses.
Apps + systems
Offline collection, roster analysis, capture histories, and plant-family comparisons.
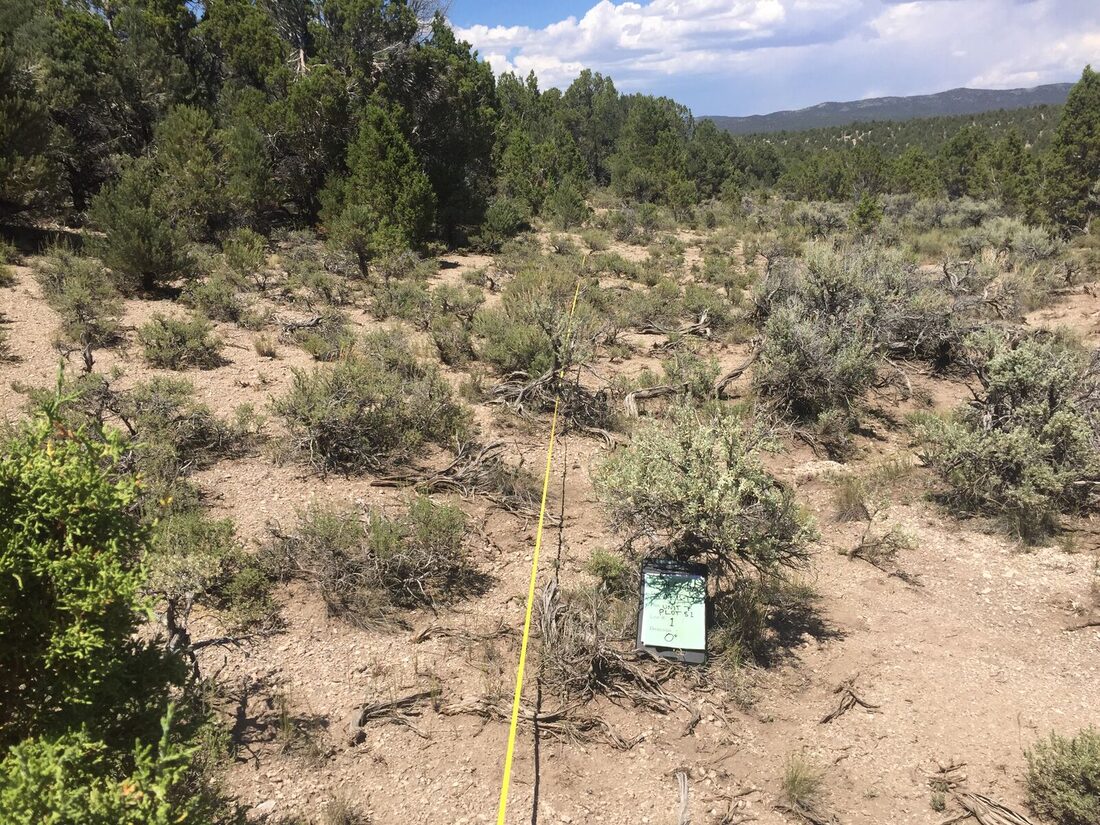
Offline vegetation data collection, cloud sync, office review, and reports. Built for places where the bars on your phone are mostly decorative.
Big 12Arizona
vsBig 12Arizona State
Compare how all 67 ACC, Big Ten, Big 12, and SEC programs build football and basketball rosters: body maps, position profiles, where the high-school talent actually comes from, and whether recruiting strength turns into wins. Yes, the name is intentional.
Demo trap line. Tap a trap to check it.
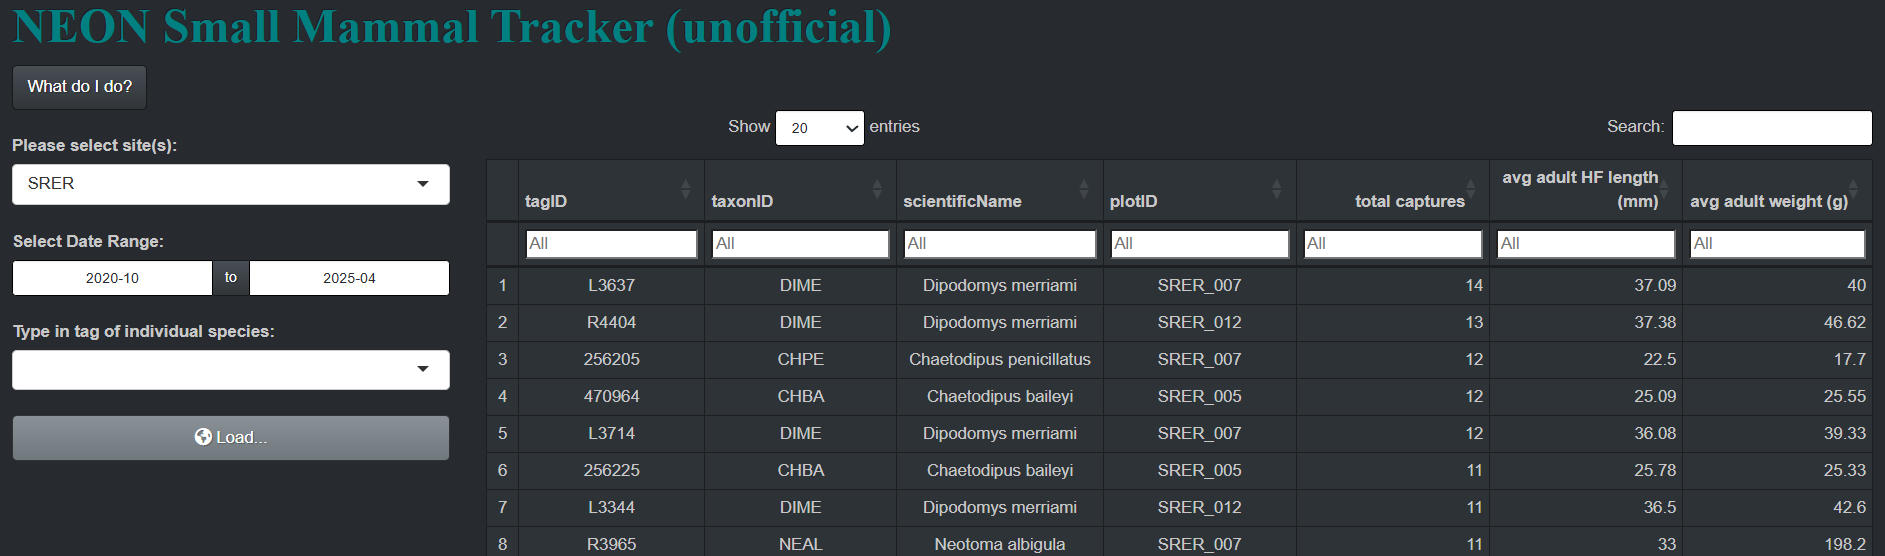
03 / ECOLOGYNational trapping records turned into animal histories, home ranges, diversity profiles, and a Hall of Fame for the most-caught little weirdos.
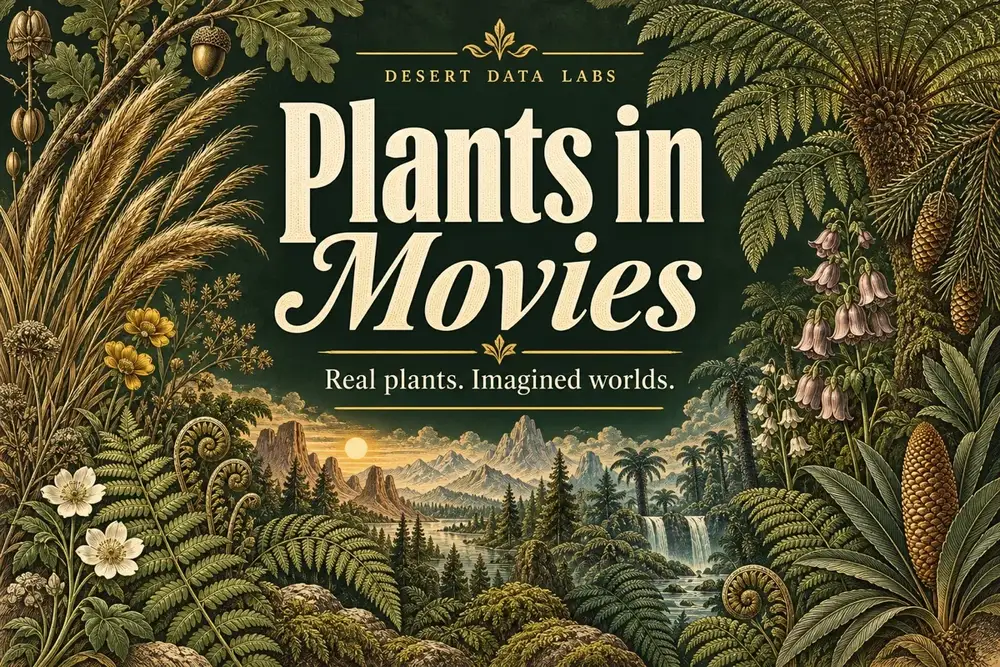
Explore Arrakis, Middle-earth and Isla Nublar through real plant records. Compare states, look closer with a specimen lens, and save your finds in a field notebook.
A few receipts
Under the hood
I’m happiest on the small, specific problems, like the offline edit that collided with someone else’s, or the trap tag that got reused. Nobody downstream should ever have to know it happened.
R Shiny apps, progressive web apps, desktop helpers, and interactive browser work.
R · Python · JavaScript · ElectronRelational models, offline sync, ETL pipelines, scrapers, and QA/QC that survive real use.
SQL · Azure · SQLite · APIsI spent years on field crews running vegetation protocols. I know what they ask of a crew, and what it is like to enter it all on a tablet.
Vegetation · Wildlife · Spatial dataMaps, charts, motion, and sound. A chart you can poke at (tap a bar, see which families drive the score) beats one you just look at.
Canvas · Plotly · ggplot2 · Audio
24 of 24 tracked animals are on this round’s list.

246 of 520 patches are on the candidate list.
10 of 20 planting sites have a reason for a visit.
All four, running at once
A Shiny demo hub with tortoise, invasive plant, and restoration workspaces, built on generated records so you can poke at everything. Each one gets the same six screens: start here, action center, register, map, outcomes, and data & methods. The desk on the left is a working miniature: pick a workspace and clear its queue.
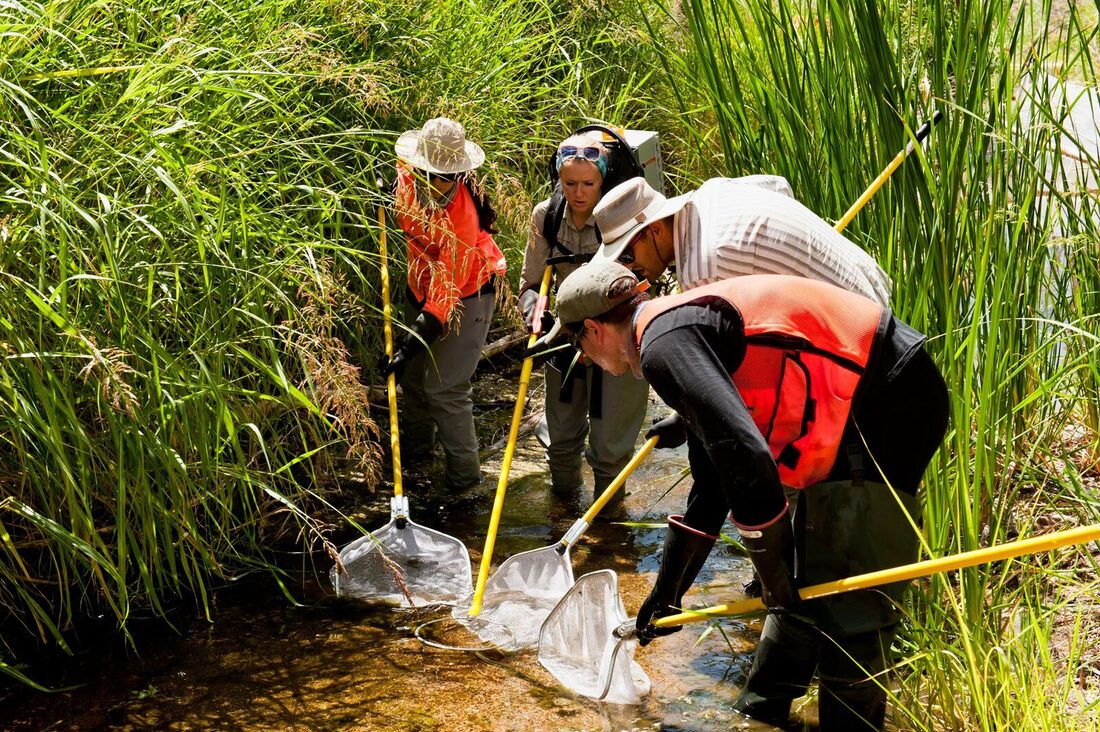
I was collecting data for NEON before I wrote any code to handle it.
Small-mammal trapping, vegetation surveys, electrofishing, and soil work. That’s why I build for one thumb in bad lighting, with no signal.
Send me the weird one
That is probably more interesting than a normal contact form.